
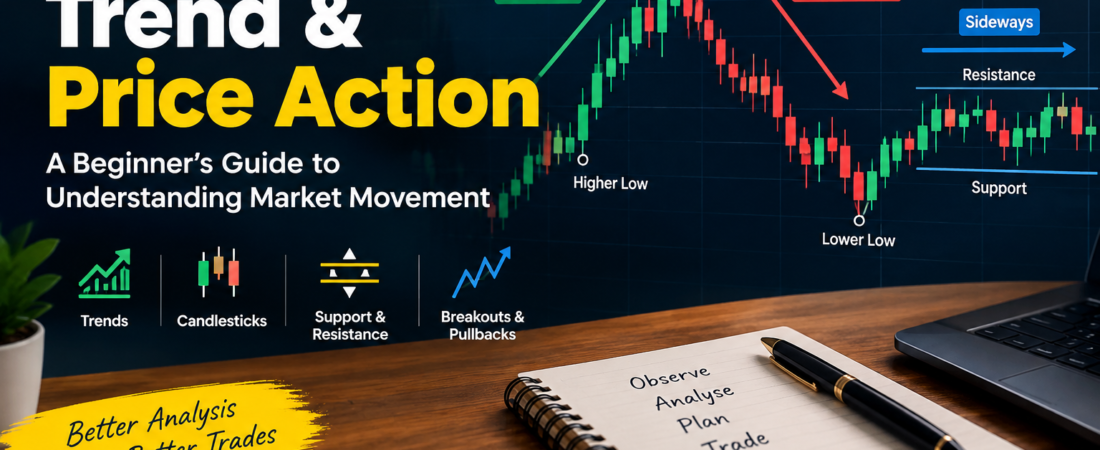
Let’s break down how price really moves in the market, because this is where a lot of people trip up. It’s easy to get distracted by the latest indicators and complicated strategies, but none of that works if you can’t read what the market itself is telling you.
There are two big pieces to get straight: Trend and Price Action.
The trend tells you if prices are moving up, down, or just drifting sideways. Price action is all those little moves you see on the chart—each candle, each swing, every little pattern. You put these together and things suddenly make a lot more sense. You might even catch some setups you’d miss otherwise.
What’s a Trend, Really?
A trend is just price pointing one way for a while. Markets either climb (uptrend), drop (downtrend), or drift in a tight band (sideways).
Uptrend
In an uptrend, price keeps punching out new highs and not dropping past the last set of lows. So you get higher lows and higher highs, over and over. That means buyers are in control. Sure, there are small dips, but as long as the overall pattern holds, so does the trend.
Downtrend
A downtrend is just the opposite: price keeps making lower highs and lower lows. Sellers are running things here. If you keep seeing price fail to break above the last peak and then drop lower, that’s your downtrend.
Sideways
Then sometimes, the market simply moves sideways. Price just bounces between support and resistance—no new highs, no new lows. This is where trend-following strategies usually fall flat. You get a lot of fake-outs, and honestly, it’s usually better to sit on your hands and wait for things to pick a direction.
What Is Price Action?
Price action means watching price movement directly, not just glancing at what an indicator spits out. You’re paying attention to candlestick shapes, whether we’re getting higher highs and higher lows, where support and resistance lines are, when breakouts happen, how pullbacks play out, if the market’s structure is shifting, and spots where price either snaps back or shoots ahead.
Bottom line: how price moves tells you who’s winning the tug-of-war—buyers or sellers.
Trend vs. Price Action
These two work together, but they’re not the same. Trend shows you the big, overall direction—bullish, bearish, or just stuck. Price action gets you into the nitty-gritty: the real details, where reversals, breakouts, and pullbacks actually happen.
Link up trend and price action and your trading plan gets a lot sturdier.
Spotting a Trend
You can spot a trend by reading the market structure.
Bullish? You’ll see higher highs and higher lows. Keep spotting that pattern? Buyers are in charge.
Bearish? Lower highs and lower lows on repeat. That’s the sellers’ market.
No real trend? Price is just bouncing between fixed highs and lows. Don’t force it—sometimes the market’s just taking a breather.
Understanding Market Structure
Market structure is a huge part of price action. When price finally pushes through a past high or low, things have changed.
For example, if you’ve been seeing higher highs and then price suddenly drops below the most recent higher low, that’s a heads-up—the uptrend might be running out of gas. Same goes in a downtrend: if price jumps above the last lower high, something’s shifting.
Does this mean the trend’s reversed? Not always. You’ve got to look at the context, the bigger timeframe, how much follow-through there is, and just how wild the swings are.
Pullbacks—Why Trends Aren’t Straight Lines
Markets never just march straight up or down. In an uptrend, price will pull back sometimes before picking up steam again. That dip is the pullback.
Uptrend, then pullback, then likely back to the uptrend. Downtrend, then pullback, then back down. Traders love pullbacks because they can offer better entries, but the trick is figuring out if the dip is just temporary or if something bigger is brewing.
Support and Resistance—Where Price Battles Happen
Support is a level where buyers step in and price usually bounces. Resistance is where sellers hold the line and price struggles. These aren’t razor-sharp lines—they’re more like zones. Sometimes price pokes above or below them briefly, so always check the bigger picture.
Candlesticks—What They Show
A single candlestick tells you where price started, how high and low it traveled, and where it ended. Think of it as a quick summary of action and emotion for whatever period you’re looking at.
In the end, if you can lock down trend and price action, you’ll start to see the market in a way that’s real—not just numbers and lines, but what’s actually going on. Indicators can wait. Start with these basics.