
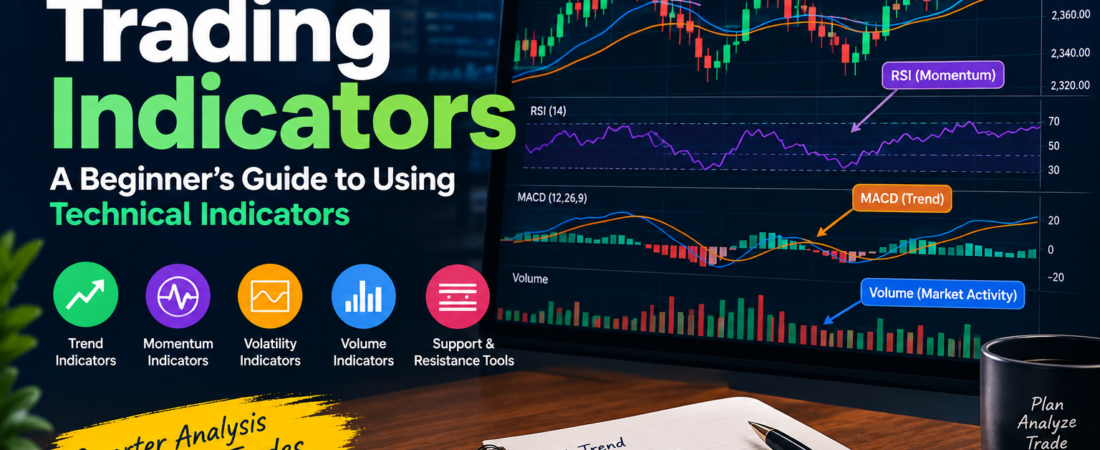
Trading can seem complicated when you first look at a price chart. Candlesticks move quickly, market conditions change, and there are many different ways to analyze price.
Trading indicators are tools that can help traders organize market information and identify trends, momentum, volatility, and potential trading conditions.
However, indicators should not be treated as prediction machines. They are based on historical or current market data, and no indicator can guarantee what price will do next.
In this guide, we’ll explain what trading indicators are, the major types of indicators, popular examples, and how beginners can use them more effectively.
What Are Trading Indicators?
Trading indicators are mathematical calculations based on market data such as:
- Price
- Volume
- Open, high, low, and close
- Time
They are displayed on a trading chart and can help traders interpret market behavior.
For example, a moving average can help identify the general direction of a market, while an oscillator such as RSI can help analyze momentum.
A simple way to understand indicators is:
Market Data → Mathematical Calculation → Indicator → Trading Information
Why Do Traders Use Indicators?
Traders use indicators for different purposes.
Some common reasons include:
- Identifying trends
- Measuring momentum
- Understanding volatility
- Studying volume
- Finding potential entry conditions
- Managing trades
- Confirming price-action observations
For example, a trader may notice that price is making higher highs and higher lows. A moving average could then be used as an additional tool to understand the broader trend.
The indicator does not replace market analysis; it provides another way of interpreting the available data.
Main Types of Trading Indicators
Trading indicators can generally be divided into several categories.
1. Trend Indicators
Trend indicators are designed to help traders understand the direction of a market.
Popular examples include:
- Moving Average
- Exponential Moving Average (EMA)
- Simple Moving Average (SMA)
- MACD
- ADX
Moving Average
A moving average calculates an average price over a specific number of periods.
For example, a 50-period moving average calculates an average based on the selected 50 periods.
Moving averages can help smooth short-term price fluctuations and make the broader direction easier to observe.
EMA vs SMA
Two commonly used moving averages are:
SMA — Simple Moving Average
Gives equal weight to the prices included in its calculation.
EMA — Exponential Moving Average
Gives greater weight to more recent prices, making it generally more responsive to recent price changes.
2. Momentum Indicators
Momentum indicators help traders study the strength or speed of price movement.
Examples include:
- RSI
- Stochastic Oscillator
- Momentum Indicator
RSI — Relative Strength Index
RSI is a momentum oscillator that moves between 0 and 100.
Traditionally:
- Above 70 may indicate relatively strong upward momentum or an overbought condition.
- Below 30 may indicate relatively strong downward momentum or an oversold condition.
However, these levels should not automatically be interpreted as sell or buy signals.
For example, during a strong uptrend, RSI can remain elevated for an extended period.
Therefore, RSI is better understood in the context of the overall market structure.
3. Volatility Indicators
Volatility indicators help traders understand how much price is moving.
A popular example is:
ATR — Average True Range
ATR measures the average range of price movement over a selected number of periods.
ATR can be useful for understanding whether the market is relatively quiet or experiencing larger price movements.
It can also be used as part of a risk-management framework, such as helping traders consider stop-loss distances based on current market volatility.
ATR does not tell you whether price will move up or down.
It focuses on how much price is moving.
4. Volume Indicators
Volume indicators use trading-volume information to provide additional context about market activity.
Examples include:
- Volume
- On-Balance Volume (OBV)
- Volume Profile
Volume can sometimes help traders evaluate whether a price movement is accompanied by relatively high or low market activity.
However, volume data can differ between markets and brokers, so traders should understand what type of volume their platform is displaying.
5. Support and Resistance Tools
Some tools are used to identify potentially important price areas.
These can include:
- Pivot Points
- Fibonacci retracement
- Previous highs and lows
- Price levels
These are not always considered indicators in the strict mathematical sense, but traders commonly use them alongside indicators and price action.
Popular Indicators for Beginners
Beginners do not need to start with ten different indicators.
A simple combination can be easier to understand.
Moving Average
Useful for studying broader trend direction.
RSI
Useful for studying momentum.
ATR
Useful for understanding volatility.
Volume
Useful for studying market activity where reliable volume data is available.
The purpose should be to understand what each tool contributes rather than adding indicators simply because they appear popular.
How to Use Indicators With Price Action
Indicators can become more useful when combined with price action.
For example:
Step 1: Identify the overall trend.
Step 2: Identify important support and resistance areas.
Step 3: Observe price behavior around those areas.
Step 4: Use an indicator as additional confirmation.
Step 5: Define entry, stop-loss, target, and risk before entering.
This approach prevents the indicator from becoming the only reason for taking a trade.
Example of a Simple Setup
Imagine an asset is in an uptrend.
Price is making:
Higher High → Higher Low → Higher High
The price then pulls back toward an important support area.
A trader could observe:
- Overall trend
- Support area
- Candlestick reaction
- Moving-average position
- Momentum
- Current volatility
If the trader’s predefined strategy requires confirmation from these factors, they can evaluate whether the setup meets their rules.
The important point is that the indicator is being used as part of a process, rather than as a standalone prediction tool.
Can You Trade Using Only Indicators?
Technically, a trading strategy can be built around indicators.
For example, a system might use:
EMA crossover → Entry condition
or:
RSI condition → Entry condition
But indicator-only strategies can generate false signals, particularly when market conditions change.
A stronger learning process is to understand:
Price Action + Market Structure + Indicators + Risk Management
This gives traders a broader framework for analyzing the market.
Leading vs Lagging Indicators
Indicators are sometimes described as either leading or lagging.
Leading Indicators
These are designed to provide signals before or around potential changes in price behavior.
Examples can include certain oscillators and momentum-based tools.
However, a leading signal does not guarantee that the expected move will happen.
Lagging Indicators
These generally respond to price movements that have already occurred.
Moving averages are a common example.
Their advantage is that they can help filter market noise and show broader trends, but they may react later to sudden changes.
Common Mistakes When Using Indicators
Using Too Many Indicators
Adding multiple indicators can make a chart confusing.
If several indicators are providing similar information, you may not be gaining much additional insight.
Treating Indicators as Guaranteed Signals
An indicator can provide a signal, but the market can still move in the opposite direction.
Ignoring Market Structure
A trader may see an RSI reading and immediately enter a trade without considering the overall trend or important price levels.
Changing Settings Constantly
Constantly changing indicator settings to find the “perfect” combination can lead to overfitting and inconsistent decision-making.
Forgetting Risk Management
A good indicator setup can still fail.
Every trading strategy needs appropriate risk controls.
How Many Indicators Should You Use?
There is no universal number that works for every trader.
For beginners, fewer indicators can make learning easier.
Instead of using many tools, understand the purpose of each one.
For example:
Trend → EMA
Momentum → RSI
Volatility → ATR
This gives each indicator a different job.
Indicators and Different Trading Styles
The usefulness of an indicator can depend on the trading timeframe and strategy.
Scalping
Traders may focus on short-term price movement, volatility, and momentum.
Day Trading
Traders may combine intraday price action with trend and momentum analysis.
Swing Trading
Traders may focus more on broader market structure and medium-term trends.
Investing
Longer-term investors may use indicators differently, often alongside fundamental analysis.
There is no single indicator that works equally well for every market and timeframe.
Indicators vs Price Action
Both approaches provide different types of information.
| Price Action | Indicators |
|---|---|
| Studies direct price movement | Uses mathematical calculations |
| Focuses on candles and structure | Can simplify or transform market data |
| Can be used without indicators | Usually depends on price/volume data |
| Helps understand market behavior | Can help identify trends, momentum, or volatility |
Many traders combine the two rather than choosing only one.
A Simple Beginner Indicator Framework
If you are learning technical analysis, you can start with a simple framework:
1. Market Structure
Determine whether the market is:
Bullish → Bearish → Sideways
2. Trend Indicator
Use a moving average to provide additional trend context.
3. Momentum
Use RSI or another momentum tool to study market strength.
4. Volatility
Use ATR to understand the current size of price movements.
5. Price Action
Observe how price behaves around important levels.
6. Risk Management
Decide your risk before entering the trade.
This creates a structured process without filling the chart with unnecessary tools.
Final Thoughts
Trading indicators can be useful tools for analyzing financial markets, but they should not be viewed as guaranteed predictors of future price movement.
The most important thing is to understand what an indicator measures, how it is calculated at a high level, and when it may become less useful.
For beginners, start with a few simple tools and learn how they interact with trend, price action, market structure, and volatility.
Remember:
An indicator is a tool—not a trading strategy by itself.
Good trading decisions also require a clear plan, disciplined execution, and appropriate risk management.
Educational content only. Trading and investing involve risk, and past market behavior does not guarantee future results.