
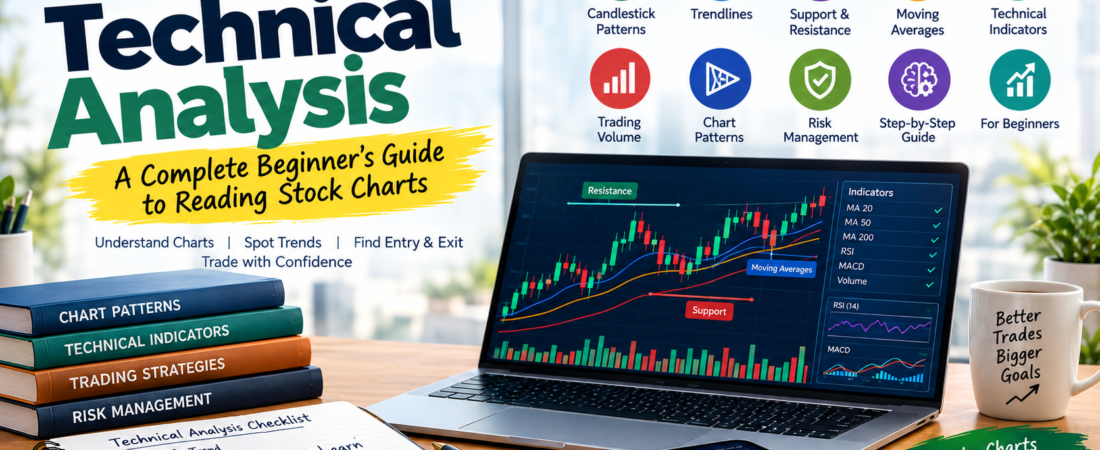
When people look at a stock chart for the first time, they often see candles, lines, numbers, and indicators everywhere. It can look complicated, but the basic idea behind technical analysis is actually quite simple.
Technical analysis is a method of studying price movements, trading volume, charts, and market patterns to identify potential trading opportunities.
Instead of primarily asking, “Is this company financially strong?”, technical analysts often ask:
“What is the market price doing, and what might it do next?”
Technical analysis is widely used by traders in stocks, forex, commodities, cryptocurrencies, and other financial markets.
What Is Technical Analysis?
Technical analysis is the study of historical market data—especially price and volume—to identify patterns and trends that may help traders make decisions.
The basic idea is that market price contains information about the buying and selling activity of market participants.
Technical analysts commonly use:
- Price charts
- Candlestick patterns
- Support and resistance
- Trendlines
- Moving averages
- Trading volume
- Momentum indicators
- Volatility indicators
- Chart patterns
Technical analysis does not guarantee what will happen in the future. Instead, it provides a framework for evaluating probabilities and managing trades.
Why Is Technical Analysis Important?
Markets rarely move in a perfectly straight line. Prices can trend upward, trend downward, or move sideways.
Technical analysis can help traders identify:
- Market trends
- Potential entry points
- Potential exit points
- Support and resistance areas
- Momentum
- Possible trend reversals
- Risk-management levels
For example, if a stock consistently creates higher highs and higher lows, a trader may interpret the market as being in an uptrend.
If the stock repeatedly creates lower highs and lower lows, it may indicate a downtrend.
The Three Basic Principles of Technical Analysis
Technical analysis is often explained through three major principles.
1. Price Discounts Available Information
Technical analysts generally assume that information affecting the market is reflected in the current price.
Instead of analyzing every piece of information separately, traders focus on what the market is actually doing.
2. Prices Tend to Move in Trends
Markets can develop trends that continue for periods of time.
The three basic market directions are:
- Uptrend
- Downtrend
- Sideways or range-bound market
Identifying the prevailing trend is one of the first steps in technical analysis.
3. History Can Repeat Itself
Technical analysts study historical price behavior because market participants can sometimes respond similarly to comparable situations.
This is one reason traders study recurring chart patterns and candlestick formations.
However, historical patterns are not guarantees of future results.
Understanding Candlestick Charts
Candlestick charts are among the most popular tools used in technical analysis.
Each candle represents price movement during a specific period.
A candle generally shows four prices:
- Open
- High
- Low
- Close
The candle’s body represents the difference between the opening and closing prices, while the wicks show the high and low reached during that period.
For example, on a daily chart, one candle represents one trading day.
On a 15-minute chart, one candle represents 15 minutes of price activity.
Support and Resistance
Support and resistance are fundamental concepts in technical analysis.
What Is Support?
Support is a price area where buying interest has historically appeared strongly enough to slow or stop a decline.
For example, if a stock repeatedly finds buyers around ₹500, traders may consider ₹500 an important support area.
What Is Resistance?
Resistance is a price area where selling pressure has historically appeared strongly enough to slow or stop an advance.
If a stock repeatedly struggles around ₹600, traders may consider ₹600 a resistance area.
Support and resistance are zones rather than perfectly precise numbers.
Trendlines
Trendlines are lines drawn on a chart to help visualize price direction.
An upward trendline can connect a series of rising lows.
A downward trendline can connect a series of falling highs.
Trendlines can help traders understand whether the market is generally moving upward, downward, or sideways.
Moving Averages
Moving averages are among the most widely used technical indicators.
They smooth price data to make the underlying trend easier to observe.
Popular moving averages include:
- 20-period moving average
- 50-period moving average
- 100-period moving average
- 200-period moving average
For example, traders may use the 50-day and 200-day moving averages to study longer-term trends.
A moving average should not be treated as a guaranteed buy or sell signal. Market conditions matter.
Popular Technical Indicators
Technical indicators use mathematical calculations based primarily on price, volume, or both.
Relative Strength Index (RSI)
RSI is a momentum indicator that measures the speed and magnitude of recent price movements.
It is commonly displayed on a scale from 0 to 100.
Traders often use the 70 and 30 levels as reference points, although these levels should not automatically be interpreted as guaranteed reversal signals.
Moving Average Convergence Divergence (MACD)
MACD is a momentum and trend-following indicator.
It is commonly used to study:
- Momentum
- Trend direction
- Potential changes in momentum
Traders often examine MACD line and signal-line relationships along with the histogram.
Bollinger Bands
Bollinger Bands consist of a moving average and bands based on price volatility.
They can help traders study:
- Volatility
- Relative price position
- Potential periods of market expansion and contraction
Average True Range (ATR)
ATR is a volatility indicator.
It does not predict whether price will rise or fall. Instead, it helps traders understand how much an asset typically moves over a given period.
ATR can therefore be useful when considering stop-loss placement and position sizing.
Common Chart Patterns
Technical analysts also study recurring chart formations.
Some popular patterns include:
Double Top
A double top occurs when price reaches a similar high twice and struggles to move above it.
Double Bottom
A double bottom occurs when price finds support around a similar low twice.
Head and Shoulders
This pattern consists of three major peaks, with the middle peak higher than the other two.
Triangle Patterns
Triangles occur when price moves within a narrowing range.
Common types include:
- Ascending triangle
- Descending triangle
- Symmetrical triangle
Patterns should be evaluated in context rather than traded blindly.
Technical Analysis and Trading Volume
Price tells traders where the market has moved, while volume can provide additional information about participation.
For example, a price breakout accompanied by relatively strong volume may be considered more meaningful by some traders than a breakout occurring on unusually weak volume.
Volume analysis is especially important in markets where reliable volume data is available.
Technical Analysis vs Fundamental Analysis
Fundamental and technical analysis approach markets differently.
| Technical Analysis | Fundamental Analysis |
|---|---|
| Focuses on price and volume | Focuses on business and financial data |
| Uses charts and indicators | Uses financial statements and ratios |
| Commonly used by traders | Commonly used by investors |
| Often focuses on timing | Often focuses on valuation |
| Studies market behavior | Studies business fundamentals |
Neither approach should be viewed as a guaranteed method of making money.
Some investors and traders combine both approaches.
How to Perform Technical Analysis Step by Step
A beginner can follow a simple process.
Step 1: Choose the Market
Select the asset you want to analyze, such as a stock, index, forex pair, commodity, or cryptocurrency.
Step 2: Choose a Timeframe
Your timeframe should match your trading or investing objective.
Examples include:
- 5-minute
- 15-minute
- 1-hour
- 4-hour
- Daily
- Weekly
Step 3: Identify the Trend
Ask:
Is the market trending upward, downward, or moving sideways?
Step 4: Mark Important Levels
Identify potential:
- Support
- Resistance
- Previous highs
- Previous lows
- Breakout areas
Step 5: Study Price Action
Look at how price behaves around important levels.
Do not rely solely on an indicator.
Step 6: Use a Few Indicators
Beginners do not need ten indicators.
A simple combination such as a moving average, RSI, and volume can be enough to start learning.
Step 7: Define Entry and Exit Conditions
Before entering a trade, know:
- Where you will enter
- Where you will exit if wrong
- Where you will take profit
- How much you are willing to risk
Step 8: Manage Risk
Risk management is one of the most important parts of trading.
A good technical setup can still fail.
Therefore, traders should determine position size and stop-loss levels before entering a trade.
Common Technical Analysis Mistakes
Using Too Many Indicators
Adding more indicators does not automatically make analysis better.
Too many indicators can create conflicting signals and confusion.
Trading Every Signal
Not every technical setup is worth trading.
Market conditions, volatility, liquidity, and risk-reward should be considered.
Ignoring Risk Management
Even a strategy with a good historical record can experience losing trades.
Never assume that a technical setup guarantees profit.
Changing Strategies After Every Loss
A losing trade does not automatically mean the strategy is broken.
Traders should evaluate a strategy over a meaningful sample of trades rather than judging it from one or two outcomes.
Ignoring the Bigger Trend
Taking a trade against a strong market trend can increase difficulty.
Higher-timeframe context can sometimes provide useful information before making a lower-timeframe decision.
Is Technical Analysis Suitable for Beginners?
Yes, but beginners should focus on learning the fundamentals instead of searching for a “perfect indicator.”
A good learning sequence is:
Candlesticks → Market Structure → Support & Resistance → Trends → Volume → Indicators → Risk Management → Trading Plan
Practice is also important.
Beginners can use historical charts or a demo account to test their understanding before risking real money.
Does Technical Analysis Always Work?
No.
Technical analysis deals with probabilities, not certainty.
Unexpected news, economic events, liquidity changes, market sentiment, and other factors can cause prices to move differently from a technical setup.
The objective should therefore not be to predict every market movement.
Instead, traders should build a process that:
- Identifies potential opportunities
- Defines invalidation levels
- Controls risk
- Avoids emotional decisions
- Accepts that losses are part of trading
Final Thoughts
Technical analysis provides traders with a structured way to study market behavior.
By learning candlestick charts, trends, support and resistance, price patterns, volume, moving averages, and technical indicators, beginners can develop a stronger understanding of how markets move.
But technical analysis is not a crystal ball.
The goal is not to find a strategy that never loses. The goal is to develop a repeatable process where potential gains, potential losses, and risk are clearly understood before taking a trade.
Learn the chart, understand the risk, and trade with a plan—not emotions.
Disclaimer
This article is provided for educational and informational purposes only. It is not financial, investment, or trading advice. Trading and investing involve risk, and losses are possible. Past performance does not guarantee future results. Always conduct your own research and consider seeking advice from a qualified financial professional before making financial decisions.