
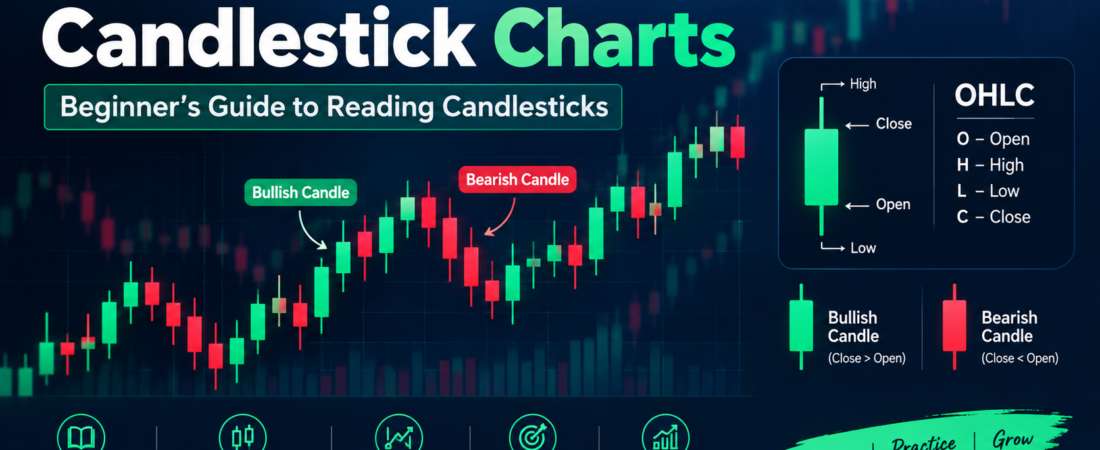
Candlestick charts are everywhere in trading. If you’re messing around in stocks, forex, gold, crypto—basically anything—you’re going to run into these little candles. Learning how to read them gives you a peek at what buyers and sellers are doing.
Let’s break it down: what candlesticks actually show, how they work, and why traders care.
What Exactly Is a Candlestick?
Think of a candlestick as a snapshot of an asset’s price over a set period—could be a minute, an hour, a day, whatever. You’ll see them on every timeframe out there.
Each candlestick has four key prices:
- Open: where the price started
- High: the highest price hit
- Low: the lowest price reached
- Close: where the price ended
Traders call this OHLC—Open, High, Low, Close.
Candlestick Anatomy
Candlesticks have two main parts:
The Body
That chunky bit represents the difference between the open and close. If it’s a big body, you know there was a lot of movement. If it’s tiny, price pretty much went nowhere—a sign the market couldn’t figure things out.
The Wick (or Shadow)
Those skinny lines sticking out? Those are the wicks. They mark the extremes (the high and low) that got hit but didn’t hold. The top wick shows the highest point, the bottom wick reveals the lowest.
Wicks matter because they show price levels where buyers or sellers got rejected—kind of like where the fight peaked.
Bullish Candlestick
When price closes higher than it opened, you’ve got a bullish candle. So if something opens at $100 and closes at $110, buyers were running the show. Usually, these candles are green, but color schemes can vary.
Bearish Candlestick
If it starts at $110 and closes at $100, that’s bearish—sellers dominated. Most charts color them red, but you can change the look however you want.
Candle Size and What It’s Telling You
Size isn’t just cosmetic. It tells you about market momentum.
Big Body
A huge bullish body means buyers are really pushing. A huge bearish body means the sellers are taking control. But don’t assume a big candle means prices will keep moving in that direction.
Small Body
Small bodies signal indecision, nobody’s really winning. If you see a cluster of small candles in a row, the market’s probably waiting for something to happen.
Reading Candlestick Wicks
Wicks are cool because they show tested price levels. The market poked up or down, but the price didn’t stick.
Long Upper Wick
When you see a long upper wick, buyers managed to push up, but sellers knocked the price back. Usually means there’s resistance at those higher levels.
Long Lower Wick
A long lower wick means sellers pushed down, but buyers stepped in and pulled price back up. That hints at support below.
But look, wicks aren’t magic indicators. You need context—a single wick doesn’t mean much unless you know what’s going on around it.
Popular Candlestick Patterns
Traders obsess over patterns. Here are a few favorites:
Doji
If open and close are nearly the same, you get a Doji. It signals indecision—nobody’s winning. Dojis matter most when they show up near big support or resistance levels.
Hammer
A hammer looks like this: small body up top, really long lower wick, almost no upper wick. Sellers tried to push price down, but buyers snapped it back up. Seeing one after a downtrend makes traders watch for a bullish reversal, but you want confirmation first.
Shooting Star
A shooting star is the reverse: small body at the bottom, long upper wick, barely any lower wick. Buyers pushed price up, but sellers shoved it right back down—after an uptrend, this can warn of a bearish reversal.
Bullish Engulfing
You get a small bearish candle, then a big bullish candle “engulfs” it. That’s buyers flexing.
Bearish Engulfing
Flip it—small bullish candle, then a bigger bearish candle swallows it. Sellers are in charge.
How Traders Use Candlesticks
Candlesticks are super useful when you mix them with other tools, like:
- Support and resistance
- Trends
- Moving averages
- Volume
- Market structure
- Supply and demand zones
- Technical indicators
Finding a Hammer in the middle of nowhere isn’t impressive. But spotting one at strong support after a downtrend—that’s a chart worth watching.
Context is everything.
Candlesticks Across Timeframes
You’ll see these patterns everywhere:
- 1-minute candle: one minute of action
- 15-minute candle: covers fifteen minutes
- 1-hour candle: a whole hour
- Daily candle: the full day
Longer timeframes show the big picture. Shorter ones zoom in for details. Most traders jump back and forth to get both views.
Can Candlesticks Predict the Market?
No pattern guarantees anything. They show who had the advantage during a period but don’t tell you what happens next.
That’s why risk management matters.
Don’t get trigger-happy just because you spot a pattern. Always think about:
- The direction of the market
- Key levels
- Confirmation from other tools
- Where you want your stop-loss
- Potential reward vs risk
Example: Reading a Candlestick
Say you’ve got a 15-minute Gold candle:
- Open: 2,500
- High: 2,515
- Low: 2,495
- Close: 2,510
Opened at 2,500, closed at 2,510—bullish. During those fifteen minutes, price swung from 2,495 up to 2,515. You can see buyers and sellers going at it.
But don’t just focus on one candle—check what happened before and after.
Beginner Tips for Candlestick Charts
If you’re new, here’s what helps:
- Start with OHLC
Really wrap your head around Open, High, Low, Close before getting fancy. - Context Is King
Always ask where the pattern’s showing up on the chart. That matters way more than the pattern itself. - Don’t Overload Your Pattern List
Stick to basics: bullish/bearish, wicks, Doji, Hammer, Shooting Star, Engulfing. The advanced stuff can come later. - Wait for Confirmation
Patterns can fool you. Look for a follow-up move before you jump in. - Practice on Old Charts
Dig into historical charts. Replay how patterns played out, see what happened next. Experience is gold.
Final Thoughts
Candlesticks make price action visual—learning OHLC, bodies, wicks, and basic patterns gives you a solid start. But don’t fall for the myth that they’re magic. Always combine them with proper analysis and risk management.
Keep practicing, watch how price reacts at levels, and don’t rush. Trading is all patience, discipline, and constant learning.
Risk is real, so treat this as a learning guide—not financial advice.
Frequently Asked Questions
What’s a candlestick in trading?
It’s a chart tool that shows open, high, low, and close prices for an asset over a specific period.
What does OHLC stand for?
Open, High, Low, Close.
What does a green candlestick mean?
Price finished higher than it started. You can usually customize colors.
What does a red candlestick mean?
Price closed lower than it opened.
Are candlestick patterns accurate?
Not really. Their value depends on context, confirmation, and extra tools.
Which timeframe works best for candlestick analysis?
There’s no single answer. Higher timeframes for a broader view, lower timeframes for details—pick what fits your way of trading.