
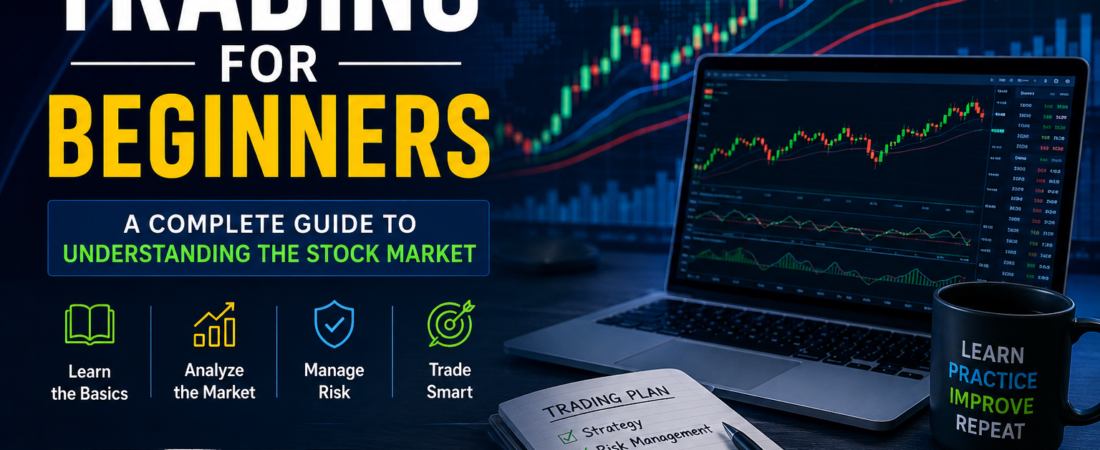
So, you want to trade? You’re not alone. Trading is one of the most talked-about ways to get involved with the financial markets, but it’s a lot more than just buying low and selling high. To actually do well, you need to get a grip on how things work, manage risk, stay disciplined, understand what’s really happening in the market, and, honestly, keep your emotions in check.
If you’re brand new, let’s break this down and give you a solid base before you risk any real money.
What Is Trading?
Trading is just buying and selling things like stocks or currencies, hoping to make money from price changes.
Some people hold trades for a few seconds. Others stick with them for weeks. It all depends on your style.
Here are some markets you might trade:
- Stocks
- Indices
- Forex (currencies)
- Commodities
- Futures
- Options
- Cryptocurrencies
Let’s say you think gold’s going to go up. You buy XAU/USD. If you’re right, you make some money. If not, you lose. Simple in theory, tougher in practice.
Trading vs. Investing
Trading and investing aren’t quite the same.
Investors usually buy an asset and hold onto it for months or years, hoping it’ll grow over time.
Traders are more concerned with short-term moves.
Some popular trading styles:
- Scalping
These folks open and close positions in seconds or minutes, aiming for tiny profits from small price swings. - Day Trading
Day traders stick to trades that start and end within the same day. - Swing Trading
Swing traders hang onto positions for a few days or weeks to catch larger moves. - Position Trading
Position traders can hold onto trades for months, following long-term trends.
How Do Traders Analyze the Market?
Everyone has their own approach, but these are two main ways:
Technical Analysis
This is all about studying price charts and market data. Traders hunt for patterns or key levels using tools like:
- Candlestick patterns
- Support and resistance
- Trendlines
- Moving averages
- RSI (Relative Strength Index)
- MACD
- Bollinger Bands
- ATR (Average True Range)
- ADX
- Volume
Technical analysis doesn’t promise you’ll know what’s coming, but it does help you stack odds in your favor and plan ahead.
Fundamental Analysis
Here, you look at what makes an asset valuable. For stocks, that could mean:
- Revenue and profit
- Debt levels
- Earnings reports
- Business growth
- The economy
- How the whole industry’s doing
When it comes to currencies or commodities, you want to keep an eye on things like interest rates, inflation, jobs numbers, and politics.
Understanding Candlestick Charts
Traders love candlestick charts. Each “candle” on the chart shows:
- Where the price opened
- The highest price reached
- The lowest price reached
- Where the price closed
The main body of the candle is the difference between open and close. The “wicks” show the extreme high and low for that period. When you look at candles together, you can spot where buyers or sellers are getting stronger.
What Are Support and Resistance?
Support is a price level where there’s enough buying interest to keep prices from dropping. Resistance is where sellers tend to show up and stop price from climbing.
But these levels aren’t set in stone. Prices can and do break through. That’s why most traders use other confirmations, not just these levels, before making a move.
Understanding Indicators
Indicators crunch market data in different ways and give you hints about what might happen.
Examples:
- Moving Averages: Show you trends and help smooth out price action.
- RSI: Tells you if something is ‘overbought’ or ‘oversold,’ indicating possible trend reversals.
- MACD: Helps you spot changes in momentum or trends.
- ATR: Measures volatility, handy for figuring out stop-loss distances.
No indicator is magic. If you pile on too many, you’ll just end up confused.
Risk Management
Risk management means making sure you don’t blow up your account. Even solid strategies fail if you can’t control your losses.
Here are some key habits:
- Decide upfront how much you’re willing to lose.
- Keep position sizes appropriate for your capital.
- Use stop-loss orders when needed.
- Don’t overuse leverage.
- Only risk what you can afford to lose.
- Don’t ‘revenge’ trade after losing money.
- Go for trades where the potential reward outweighs the risk.
Say you risk ₹1,000 to try to make ₹2,000. That’s a 1:2 risk-reward, which makes sense if you can win often enough. But it doesn’t guarantee profits on its own.
What Is a Trading Strategy?
A strategy is your personal set of rules for trading. It should cover:
- When to enter a trade
- Where to put your stop-loss
- Where to take profit
- How much of your capital to risk
- What markets and timeframes to focus on
- What makes you skip or exit a setup
Always test your strategy before you go live with big money.
Backtesting
Backtesting means checking if your strategy would’ve worked in the past by looking at historical data. You’ll find out things like:
- Win rate
- Average win and average loss
- Maximum losing streak (“drawdown”)
- Total number of trades
- Risk-to-reward ratio
Remember, past performance isn’t a guarantee for the future.
Paper Trading
With paper trading, you practice trading with fake money. It’s a safe way to learn how orders work, what the charts look like, how to run your strategy, and (most importantly) how your emotions affect decisions.
Trading platforms like TradingView make it easy to try things out and see what works—no risk involved.
Trading Psychology
Most beginners totally underestimate the “mental” game. Emotions like fear, greed, impatience, or overconfidence mess up even the best strategy fast. Sticking to your rules and accepting that losses happen is crucial.
Trading isn’t about winning every trade. It’s about following your plan and managing risk.
Common Mistakes Beginners Make
- Trading Without a Plan
Random trades usually lead to random (bad) results. - Using Too Much Leverage
Bad trades get much worse, much faster. - Chasing the Market
Jumping in just because a price is running can kill your profits. - Moving Your Stop-Loss
Shifting your stop to avoid taking a loss just increases your risk. - Overtrading
Too many trades mean too many fees—and too much stress. - Believing Guarantees
If someone tells you their system never loses, walk away. - Risking Too Much
One big loss can wipe out weeks or months of gains.
A Smarter Way to Learn Trading
Don’t try and master everything at once. Here’s a better order:
Step 1: Learn market basics.
Step 2: Get familiar with candlestick charts.
Step 3: Understand trends, support, and resistance.
Step 4: Dig into technical analysis.
Step 5: Practice risk management.
Step 6: Study trading psychology.
Step 7: Create a simple, clear strategy.
Step 8: Backtest your approach.
Step 9: Practice with demo or paper trading.
Step 10: Only trade real money once you know the risks and have shown you’re consistent.
Final Thoughts
Trading isn’t a guaranteed way to get rich—it’s challenging and takes continual learning and self-control. Instead of searching for a perfect, never-losing system, focus on building a repeatable process: clear entries, proper risk, smart position sizing, and sensible goals.
If you’re just starting out, don’t expect to make money right away. Aim to really understand the market, protect your capital, build good habits, and improve your decision-making over time.
Once you’ve got those basics, you can tackle the more advanced stuff—like price action, market structure, liquidity, futures, options, or even algorithms. For now, stick to the fundamentals and take your time.