
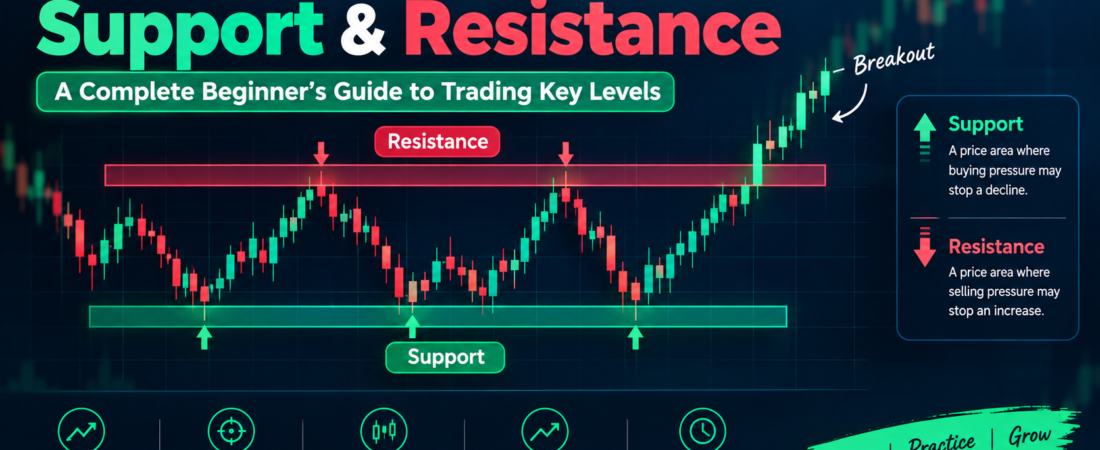
Support and resistance are two of the most important concepts in technical analysis. Traders use these levels to understand where price may slow down, reverse, break through, or consolidate.
Whether you trade stocks, forex, gold, cryptocurrencies, or indices, understanding support and resistance can help you read price charts more effectively.
In this beginner-friendly guide, we’ll explain what support and resistance are, how to identify them, how traders use them, and some common mistakes to avoid.
What Is Support?
Support is a price area where buying pressure may become strong enough to slow down or stop a decline.
When price falls toward a support area, buyers may become more interested in entering the market. As a result, price may bounce upward from that area.
For example, if an asset repeatedly falls toward $100 and then moves higher, traders may consider the $100 area a potential support level.
However, support is not a guarantee that price will always bounce.
If selling pressure becomes strong enough, price can break below support.
What Is Resistance?
Resistance is a price area where selling pressure may become strong enough to slow down or stop a price increase.
When price approaches a resistance area, sellers may become more active, potentially causing price to move lower.
For example, if an asset repeatedly rises toward $150 but struggles to move above it, traders may consider the $150 area a potential resistance level.
Just like support, resistance is not guaranteed to hold.
Strong buying pressure can cause price to break above resistance.
Support vs. Resistance
The basic difference is simple:
| Support | Resistance |
|---|---|
| Usually found below the current price | Usually found above the current price |
| Can slow a downward move | Can slow an upward move |
| Buyers may become more active | Sellers may become more active |
| Price may bounce upward | Price may move downward |
These levels help traders identify important areas where the balance between buyers and sellers may change.
How Support and Resistance Work
Support and resistance are based on the interaction between buyers and sellers.
Imagine a stock repeatedly reaches $100 and then moves higher.
Traders who notice this behavior may remember the $100 area.
When price approaches $100 again, some buyers may enter because they believe the price is attractive.
At the same time, traders who previously bought near $100 may also be watching the area.
This increased attention can make the level important.
The same idea applies to resistance.
If price repeatedly struggles near $150, traders may watch that area for possible selling pressure.
Support and Resistance Are Usually Zones
One of the biggest mistakes beginners make is treating support and resistance as exact lines.
In real markets, price does not always reverse at exactly the same number.
Instead, support and resistance are often better viewed as zones or areas.
For example, instead of saying:
Support = $100 exactly
A trader might identify:
Support zone = $98–$102
Price may move slightly below or above the previous level before reversing.
This is why focusing on areas rather than perfectly precise lines can provide a more realistic view of price behavior.
How to Identify Support and Resistance
There are several ways traders identify important levels.
1. Previous Highs and Lows
Previous swing highs and lows are among the simplest places to look.
A previous swing low may act as support.
A previous swing high may act as resistance.
The more significant the price reaction from an area, the more attention traders may give to it.
2. Multiple Price Reactions
If price repeatedly reacts around the same area, that zone may become more significant.
For example:
Price reaches resistance → falls
Price reaches resistance again → falls
Price reaches resistance again → falls
This repeated reaction can make the resistance zone important to traders.
However, repeated tests can also eventually weaken a level, especially when buying or selling pressure continues to increase.
3. Psychological Price Levels
Round numbers can sometimes attract attention.
Examples include:
- $100
- $500
- $1,000
- 1.1000 in forex
- 2,000 in an index
These are sometimes called psychological levels because traders naturally pay attention to simple, memorable prices.
They should not automatically be treated as support or resistance, but they can become important when combined with actual price reactions.
4. Trendlines
Trendlines can also act as dynamic support or resistance.
During an uptrend, an ascending trendline may act as support.
During a downtrend, a descending trendline may act as resistance.
Trendlines should be drawn using meaningful swing points rather than forcing a line through random prices.
5. Moving Averages
Some traders use moving averages as dynamic support and resistance.
Common examples include:
- 20 EMA
- 50 EMA
- 100 EMA
- 200 EMA
For example, during a strong uptrend, price may repeatedly pull back toward a moving average before continuing higher.
However, moving averages are indicators rather than guaranteed support or resistance levels.
What Happens When Support Breaks?
When price moves decisively below a support zone, the market may continue lower.
A broken support level can sometimes become resistance.
This is commonly referred to as role reversal.
For example:
Support → Price breaks below → Retest → Resistance
However, not every break will result in a successful role reversal.
Some breakouts are false breakouts, where price briefly moves beyond the level and then returns back inside the previous range.
What Happens When Resistance Breaks?
When price moves decisively above a resistance zone, the market may continue higher.
The previous resistance area can sometimes become support.
For example:
Resistance → Price breaks above → Retest → Support
This is another example of role reversal.
Traders often watch the retest because it can provide additional information about whether the breakout has strength.
Breakout vs. False Breakout
A breakout occurs when price moves beyond an important support or resistance area.
A false breakout occurs when price moves beyond the level but fails to maintain the move and returns back inside the previous range.
For example:
Resistance = $150
Price moves to $153 → appears to break resistance
Price then falls back below $150
This could be considered a false breakout.
False breakouts are one reason traders often wait for confirmation instead of entering immediately when price crosses a level.
Support and Resistance With Candlesticks
Candlestick analysis can be combined with support and resistance.
For example, suppose price reaches a strong support zone and forms a bullish rejection candle.
This may suggest that buyers are responding to the area.
Similarly, if price reaches resistance and forms a strong bearish rejection candle, it may indicate increased selling pressure.
Other patterns traders may watch include:
- Hammer
- Shooting Star
- Bullish Engulfing
- Bearish Engulfing
- Doji
A candlestick pattern by itself does not guarantee a reversal.
The location of the pattern is often just as important as the pattern itself.
Support and Resistance With Market Structure
Support and resistance can also be used with market structure.
In an uptrend, traders may observe:
Higher High → Higher Low → Higher High → Higher Low
Previous higher lows may become important support areas.
In a downtrend:
Lower Low → Lower High → Lower Low → Lower High
Previous lower highs may become important resistance areas.
Combining market structure with key levels can give traders a broader understanding of price behavior.
How Traders Use Support and Resistance
Traders use these levels in several different ways.
1. Reversal Trading
Some traders look for price to reverse from a support or resistance zone.
For example:
Support → Bullish confirmation → Potential long setup
Resistance → Bearish confirmation → Potential short setup
2. Breakout Trading
Some traders wait for price to break through an important level.
For example:
Resistance breaks → Price holds above → Potential continuation setup
3. Retest Trading
Instead of entering immediately after a breakout, some traders wait for price to return to the broken level.
For example:
Resistance breaks → Price moves higher → Returns to resistance → Holds as support
This can provide additional confirmation.
Example of Support and Resistance
Imagine a stock is trading around $120.
Over several sessions:
- Price falls to $110 and rises.
- Price falls to $111 and rises.
- Price falls to $109 and rises.
This suggests that the $109–$111 area may be a potential support zone.
Now imagine price repeatedly rises toward $130 and falls.
The $129–$131 area may be a potential resistance zone.
The trader can then monitor how price behaves when it reaches either area.
The important point is that the levels are not guaranteed to work every time.
Common Mistakes Beginners Make
Mistake 1: Drawing Too Many Levels
If your chart is filled with dozens of support and resistance lines, it can become difficult to identify the most important areas.
Focus on significant levels.
Mistake 2: Treating Levels as Exact Prices
Markets rarely respect perfectly precise numbers.
Think in terms of zones rather than single lines.
Mistake 3: Entering Without Confirmation
Price reaching support does not automatically mean “buy.”
Price reaching resistance does not automatically mean “sell.”
Wait for your trading strategy’s confirmation.
Mistake 4: Ignoring the Overall Trend
A support bounce in a strong downtrend may be temporary.
Similarly, a resistance rejection during a powerful uptrend may fail.
Always consider the broader market structure.
Mistake 5: Ignoring Risk Management
Even a strong-looking setup can fail.
Traders should determine their risk before entering a trade and use appropriate position sizing.
Support and Resistance in Different Markets
Support and resistance can be applied to many financial markets, including:
- Stocks
- Forex
- Gold
- Silver
- Cryptocurrencies
- Indices
- Commodities
The exact behavior of levels can vary depending on the market, liquidity, volatility, and timeframe.
Support and Resistance on Different Timeframes
Support and resistance can appear on every timeframe.
For example:
- 5-minute charts can show short-term levels.
- 15-minute charts can show intraday levels.
- 1-hour charts can show broader intraday structure.
- Daily charts can show major market levels.
- Weekly charts can reveal longer-term areas.
A level visible on a higher timeframe may attract more attention than a minor level visible only on a very short timeframe.
Many traders therefore use multiple timeframes to build context.
Final Thoughts
Support and resistance are fundamental concepts that every beginner trader should understand.
They help traders identify areas where buying and selling pressure may change and where price could potentially react.
However, these levels should not be treated as guaranteed reversal points.
The most effective approach is to combine support and resistance with market structure, candlestick behavior, trend analysis, confirmation, and disciplined risk management.
Start by marking only the most important levels on your charts. Then observe how price behaves around those areas instead of immediately placing trades.
With consistent practice, support and resistance can become a valuable part of your technical-analysis toolkit.
Trading involves risk. This article is for educational purposes only and should not be considered financial advice.
Frequently Asked Questions
What is support in trading?
Support is a price area where buying pressure may become strong enough to slow or stop a decline.
What is resistance in trading?
Resistance is a price area where selling pressure may become strong enough to slow or stop an upward move.
Is support and resistance always accurate?
No. Support and resistance are areas of potential price reaction, not guaranteed levels. Price can break through them.
Can support become resistance?
Yes. After a decisive breakdown, a previous support area can sometimes act as resistance during a later retest.
Can resistance become support?
Yes. After a breakout above resistance, the previous resistance zone can sometimes become support.
Should beginners use support and resistance?
Yes. It is one of the basic concepts of technical analysis and can help beginners understand price structure and market behavior.
What is the best timeframe for support and resistance?
There is no single best timeframe. Higher timeframes can help identify major levels, while lower timeframes can help traders analyze shorter-term price movements.
Can support and resistance be used with candlestick patterns?
Yes. Many traders combine key levels with candlestick patterns and other forms of technical analysis to look for confirmation.